Geographical Context: Columbus, Ohio as an urban experiential classroom
Question: How can we think and learn about urban places – the way they change, why they change, what forces shape them and how they shape us?
Engaging Columbus is a collaboration between Ohio Wesleyan University, the Ohio Five Libraries, the City of Columbus Department of Technology / Geographic Information Systems and other partners in central Ohio. Information on this site will be used for urban courses at Ohio Wesleyan University and Denison University in the Spring of 2015, but is fully available to all users.
Funded by a grant from the Andrew W. Mellon Foundation to the Five Colleges of Ohio. [Digital Collections from Projects to Pedagogy and Scholarship, 2013.]
Site contents:
Context: key concepts, sources and literature on the context of the materials provided at this site.
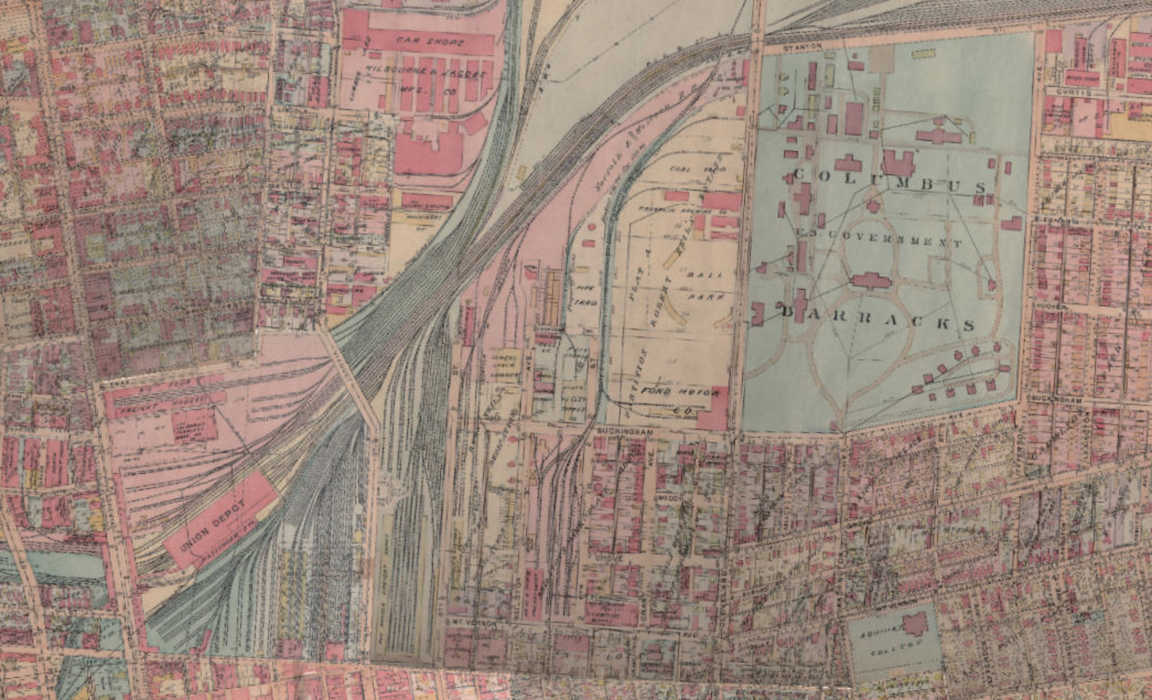
Baist’s Atlases: Interactive apps of three large historical real estate atlases of Columbus, Ohio created and published by the G. William Baist Company of Philadelphia, Pennsylvania, in 1899, 1910, and 1920. The maps in Baist’s atlases were created for real estate title searches and include detailed building, subdivision, infrastructure and street data. They were beautifully designed and colored, and produced for dozens of U.S. cities, but in small quantities. Most were heavily used, annotated, worn out and eventually discarded by their users. Few Columbus atlases survive and none were previously available in digital form.
High-resolution scans of the 1899, 1910 and 1920 Baist’s Atlases in TIFF and PDF formats are available at Ohio Wesleyan University’s Digital Collections.
Photographs: Two maps of historical images from the Columbus area. The first map provides a series of panoramic street scenes around Columbus taken as part of a 1922 Ohio State University thesis by Forest Ira Blanchard. The second map contains hundreds of historical images culled from the Columbus Memory Project and other web sources.
Census 1930: U.S. Census data from 1930, the first year that relatively small census tract areas were used in the City of Columbus. This resolution of data allows for comparisons between different areas of the city. A few dozen data variables including population, gender, ethnicity, race, etc. are mapped.
Census 2010: The most recent U.S. Census decennial census data for Columbus.
Census Compare: a series of map apps allowing for the comparison of 1930 and 2010 census data.
Ethnic: Information on early 20th century ethnic and racial patterns in Columbus.
Redlining: 1930s maps used to regulate mortgages (and typically to deny mortgages to residents of poor and minority neighborhoods)
Districts: Map app of the various neighborhoods, historical districts, etc. in the City of Columbus.