Thinking and learning about urban places – the way they change, why they change, what forces shape them and how they shape us requires historical urban data (statistics, maps) and an understanding of the concepts and theories surrounding the collection and use of the data.
A brief overview of key concepts and sources useful for understanding the context of the maps and data on Engaging Columbus includes:
- Mapping the Urban Built Environment (go to…): A brief overview of the history of mapping urban environments.
- Mapping the Urban Social Environment (go to…): A brief overview of collecting data and mapping urban social environments.
- Mapping the Urban Built and Social Environment in Columbus (go to…): A series of historical sources and resources on Columbus.
Mapping the Urban Built Environment
Mapping cities has a long history. Among the earliest maps are those showing property boundaries in Mesopotamian cities (ca. 1300 BC).  The concept of property ownership, and the need to survey and inventory (with maps) property boundaries and parcels has been a significant driving force behind detailed mapping to the present time.
Our Engaging Columbus project, using funds from the Mellon Foundation, has scanned and georectified and georeferencing a series 1899, 1910, 1920) of detailed atlases for Columbus created for property and real estate research. These Baist’s Atlases of Columbus detail buildings, property boundaries, subdivisions, streets, public spaces, water features, and other urban phenomena, providing maps of property and the built environment of Columbus over 30 years in the early 20th century. Baist’s Atlases also have subtle social data: for example, ethnicity is suggested by the kind of places of worship, the economic landscape by the kinds of factories, and institutions (“Hospital for the Insane,” “Deaf and Dumb Asylum”). Sanborn Fire Insurance Maps (created around the same time to document building characteristics for determining insurance fees) are a complementary, late 19th and 20th century source of detailed urban maps.
- History of the City Map: Wikipedia overview here.
- Sanborn Maps: Wikipedia overview here. Five Colleges of Ohio students and faculty can access Ohio Sanborn Maps here.
- Conceptualizing the City by Keith Lilly here.
Mapping the Urban Social Environment
While a subtile social landscape can be read from city atlases like Baist’s, other sources supplement such atlases of the built urban environment. A series of studies (detailed below) focused on Columbus in the 1920s provide a wealth of data on the social geography of the city. These sources can be understood in a broader context of urban social mapping, including the work of Charles Booth, Hull House, the Chicago School of Sociology and the U.S. Census Bureau.
| The mapping of detailed social data on urban maps, propelled by moral and social reformers in the 19th century, is exemplified by the London maps of philanthropist Charles Booth. Booth’s detailed maps of poverty and wealth (legend to the right), with an accompanying series of books Life and Labour of the People (3rd edition in 17 volumes, 1902–03) played a significant role in initiating governmental anti-poverty programs, old age pensions and free school lunches in the early 20th century. | 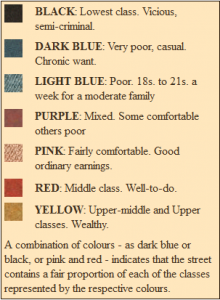 |
| Hull House, a settlement house in Chicago, provided assistance to a poor, largely immigrant population. Middle class volunteers worked with low-income individuals and families, sharing social and cultural knowledge in the hope of alleviating poverty through behavioral intervention. Inspired by Booth’s mapping of London Poverty and social characteristics, social reformer Florence Kelley (funded by the U.S. Department of Labor) documented and mapped social conditions in Chicago, including nationality and wages in the early 20th century, and inspired similar data collection and mapping projects in other US cities. |
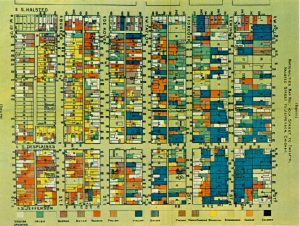 |
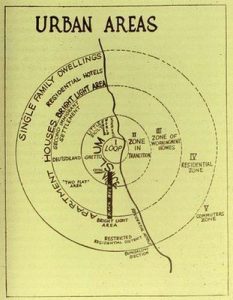
The Chicago School of Sociology, also known as Urban Sociology or Urban Ecology, produced scholars who studied the city and its spatial patterns, collecting large amounts of data and documenting their work with photographs and maps. Inspired by Booth’s work in London and the Kelley’s Hull House work in Chicago, the Chicago School sociologists set out collect and map social data within a scholarly, academic context. While accused of being more interested in empirical data than in theory, the Chicago School scholars were strongly influenced by evolutionary thinking (from the biological sciences), suggesting theories of urban development and form (such as the concentric zone model) that strongly influenced the academic study of urban spaces, development, and social geography.
|
 |
| The U.S. Census Bureau, constitutionally mandated to count all U.S. citizens every ten years (to ensure equal representation under the constitution) has expanded the scope of data collected to encompass social and economic data similar to that collected by Booth, Kelley and Chicago School Sociologists. Collection of such data in areas small enough to be able to document spatial patterns in cities began in the 1920 Census, and was expanded (to include Columbus for the first time) in the 1930 Census. The social and economic data collected by the U.S. Census bureau have a significant impact on government social welfare programs and patterns of spending, and are extensively used by private sector and academics to understand social patterns in urban areas. | 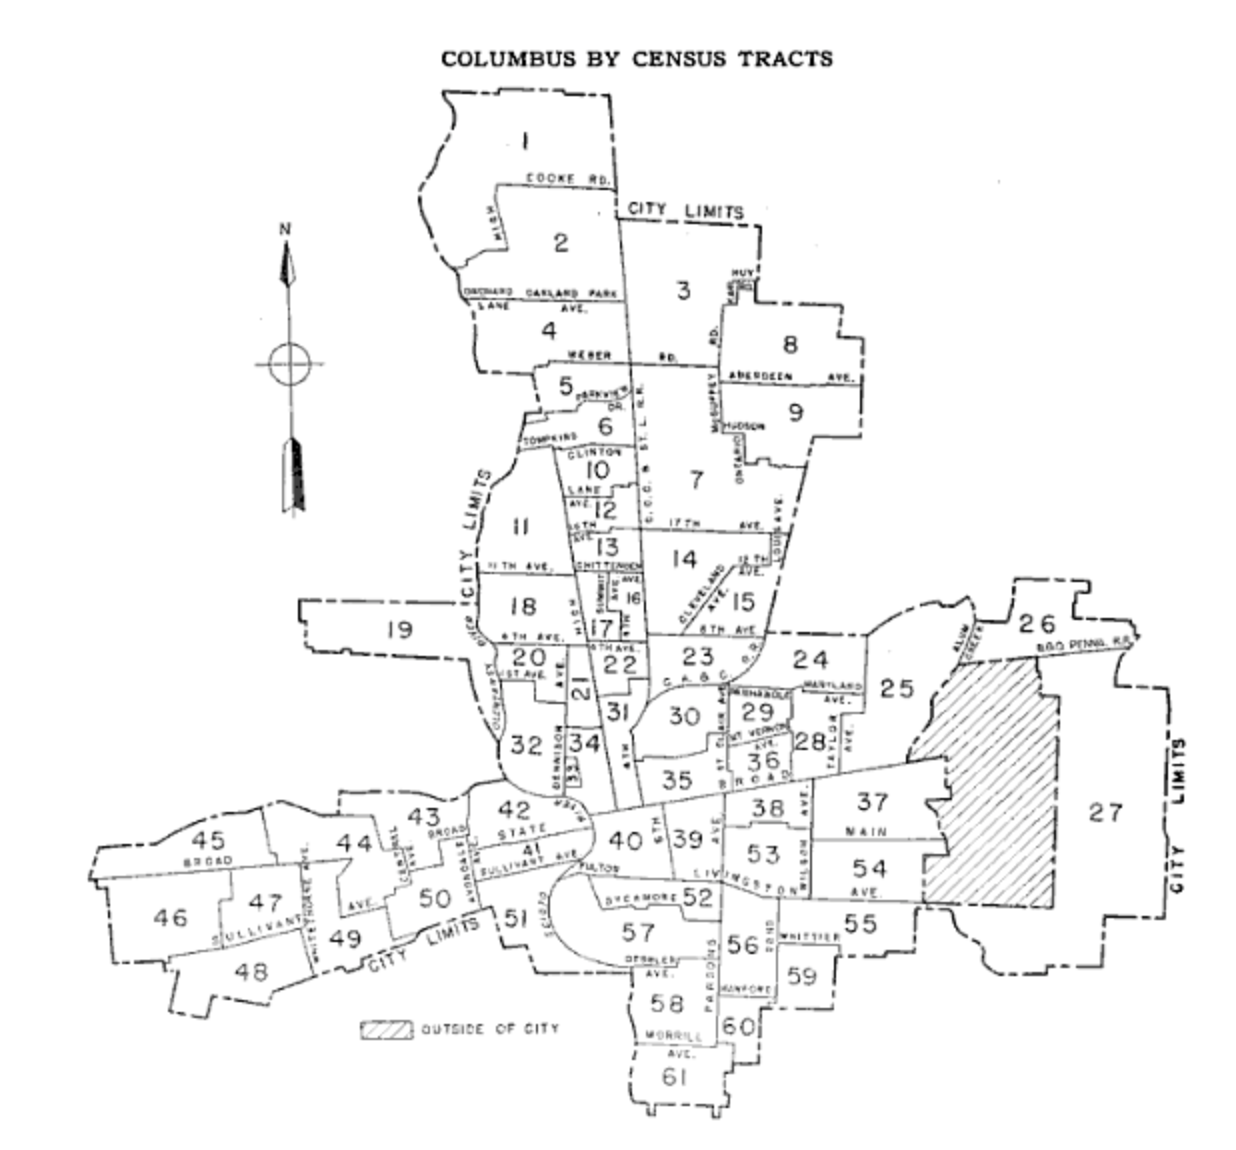 |
Mapping the Urban Built and Social Environment in Columbus
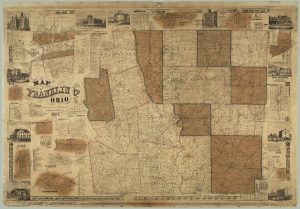
1856: Property Map of Franklin County, Ohio
John Graham, Published by R.C. Foote (Philadelphia). From the Franklin County Engineer’s Office (source). Full size 10.5mb PDF here.
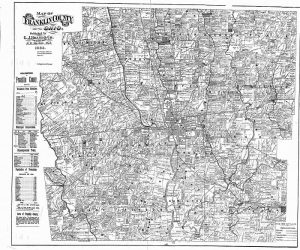
1883 Property Map of Franklin County, Ohio
G.J. Brand, Columbus, Ohio. From the Franklin County Engineer’s Office (source). Full size 4.5mb PDF here.
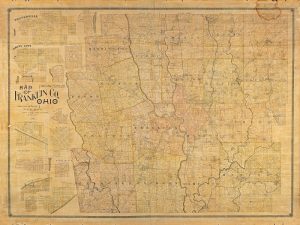
1895 Property Map of Franklin County, Ohio
Walter Brand, Columbus, Ohio. From the Franklin County Engineer’s Office (source). Full size 7.5mb PDF here.
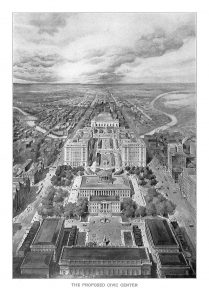 1908: Report of the Plan Commission for the City of Columbus Ohio
By Austin W. Lord, Albert Kelsey, Charles N. Lowrie, Charles Mulford Robinson, H.A. McNeil. Columbus, Ohio, 1908.
Report here (17mb PDF).
In 1906, the Columbus City Council approved a five-member commission to study “the streets, alleys, parks, boulevards and public grounds,” of the downtown area. The commission included an architect, landscape architect, and sculptor from New York City, as well as an architect from Philadelphia. Also appointed was Charles Mumford Robinson who the Columbus Dispatch claimed was “one of the most noted landscape architects of the country.” This plan they produced typifies the “City Beautiful” movement that dominated urban planning at the turn of the twentieth century. The movement, perhaps best articulated in Chicago, hoped to bring moral and civic virtue to urban residents through monumental grandeur.
1922: An Introduction to the Economic and Social Geography of Columbus, Ohio
By Forest Ira Blanchard. Thesis (M.A.), Ohio State University, 1922.
Blanchard’s Thesis here (10.7mb PDF) cleaned up by Matthew Adiar and the Center for Urban and Regional Analysis at The Ohio State University. Original thesis here (10.2mb PDF) or on Google Books here. High resolution images from Blanchard’s work are geolocated in our City of Columbus Historic Panoramic Images, 1922 app here.
Forest Ira Blanchard earned the first Geography Master’s Degree at Ohio State University. His thesis was advised by C.C. Huntington. Blanchard’s thesis was researched and written around the same time as McKenzie’s The Neighborhood and is also influenced by the Chicago School of Sociology with its emphasis on empirical data collection. Blanchard set out with a panoramic camera (a somewhat rare device at the time) to document areas with specific ethnic, racial and economic concentrations. Blanchard’s thesis is remarkable in that the photos are not of significant buildings, monuments or locations, but instead relatively mundane street scenes – rare content for the era and a valuable resource for assessing urban changes.
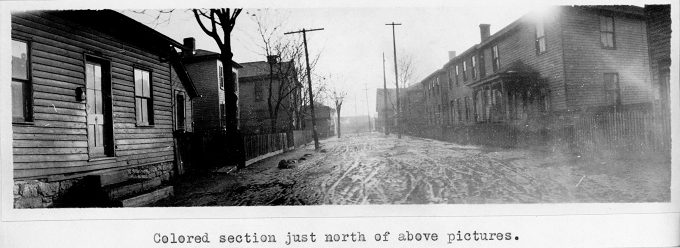 Flytown – African American neighborhood west of Goodale Park.
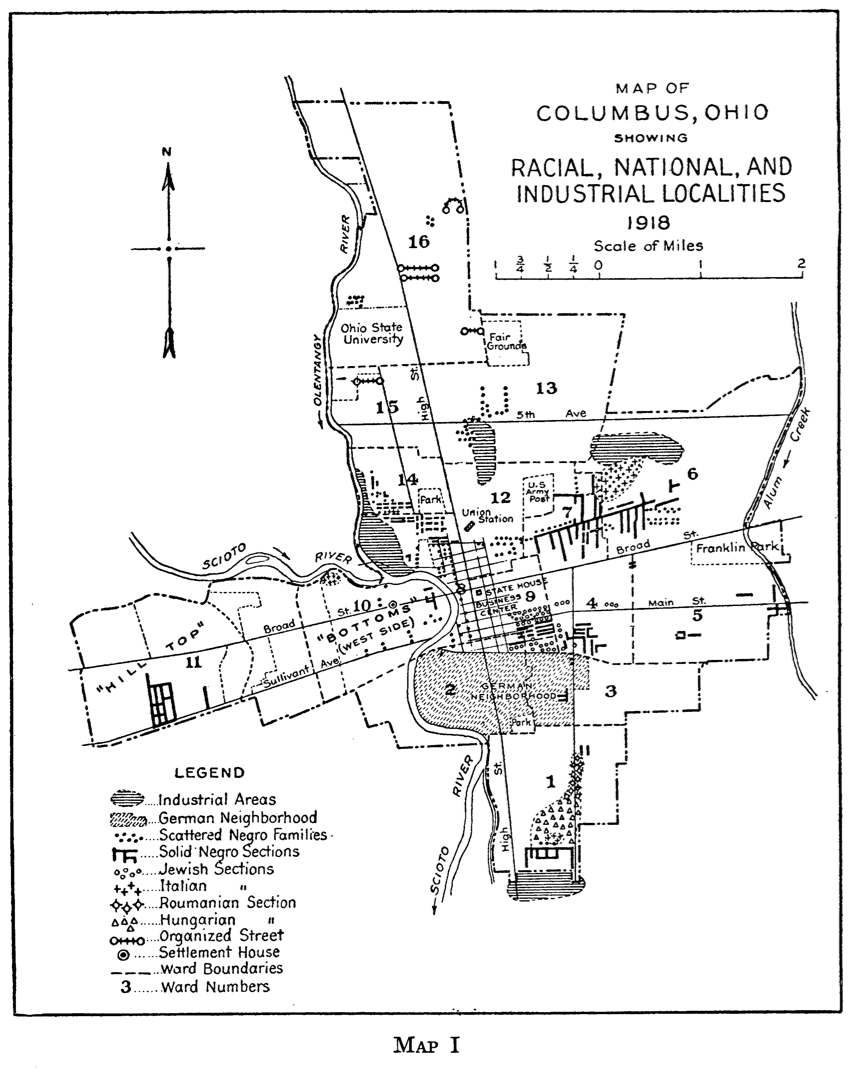
Also in Blanchard’s thesis are five manuscript maps. On each, Blanchard sketched out data he collected on areas of Columbus on a printed city road map. The maps are linked below, with a description of their content.
Map 1: Location of Industries, Sphere of the Influence of Railroads and Industries, and Telephone Conduits. Map here (8.1mb PDF).
Map 2: Location of Street Car lines, Retail Stores, and Telephone Conduits. Map here (9.7mb PDF).
Map 3: Location of Colored Settlements and Telephone Conduits. Map here (7mb PDF).
Map 4: Location of Italian and other Foreign Settlements. Map here (5.3mb PDF).
Map 5: Location of Better Class Residential Settlements. Map here (7.7mb PDF).
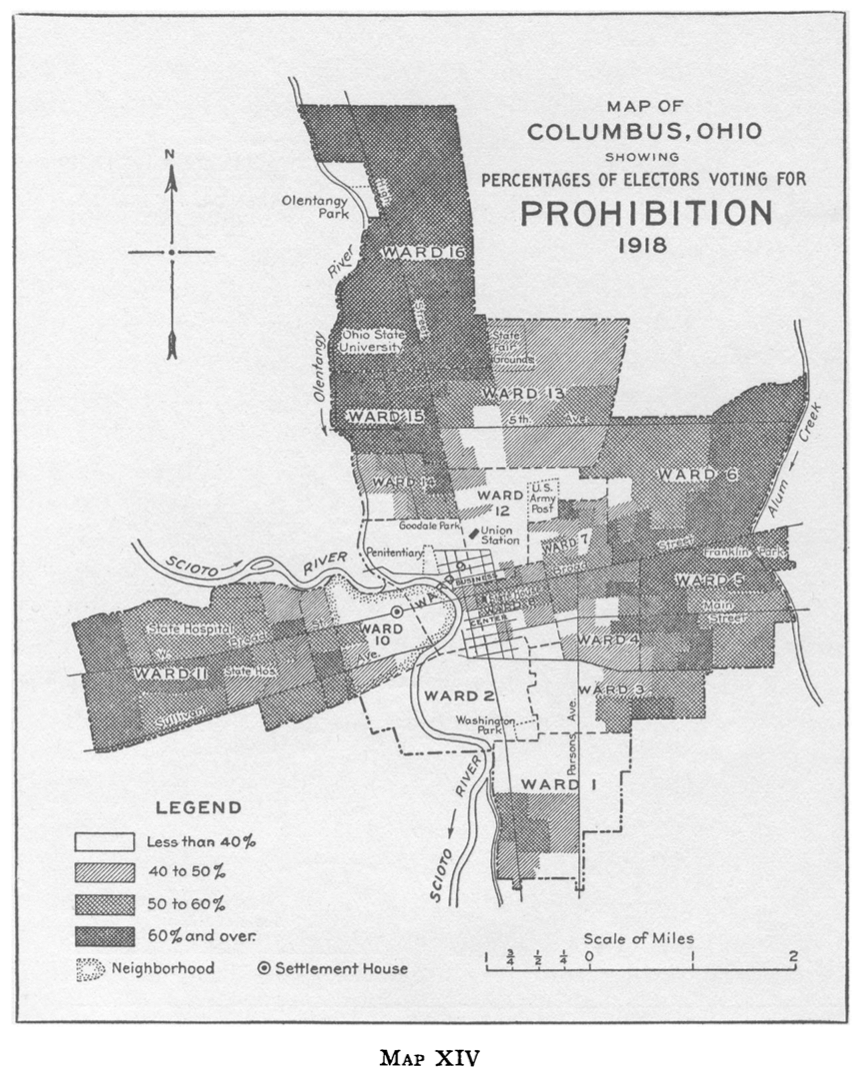
1923: The Neighborhood: A Study of Local Life in the City of Columbus, Ohio
By R. D. McKenzie. American Journal of Sociology, Vol. 27, No. 2 (Sep., 1921), pp. 145-168, Vol. 27, No. 4 (Jan., 1922), pp. 486-509, Vol. 27, No. 3 (Nov., 1921), pp. 344-363 and Vol. 27, No. 5 (Mar., 1922), pp. 588-610. Collected together as The Neighborhood: A Study of Local Life in the City of Columbus, Ohio. Chicago: University of Chicago Press, 1923.
Articles here (10.2mb PDF)
McKenzie’s dissertation (from the University of Chicago, but completed while he was in Columbus) is classic Chicago School of Sociology: a focus on fieldwork and collecting empirical data (particularly ethnic and racial data) as a means of understanding the human patterns in cities. Contains a wealth of information about Columbus neighborhoods and their social patterns around 1920. Published as a series of articles, then as a book by the University of Chicago Press.
The first map below was the source for the Racial, National, and Industrial Localities map app at this site (here). The second map shows the homes of “delinquents” (under court supervision). The final pair of maps shows voting patterns in Columbus on prohibition and women’s suffrage. A visual comparison suggests that districts voting for women’s rights were also strongly supportive of prohibition.


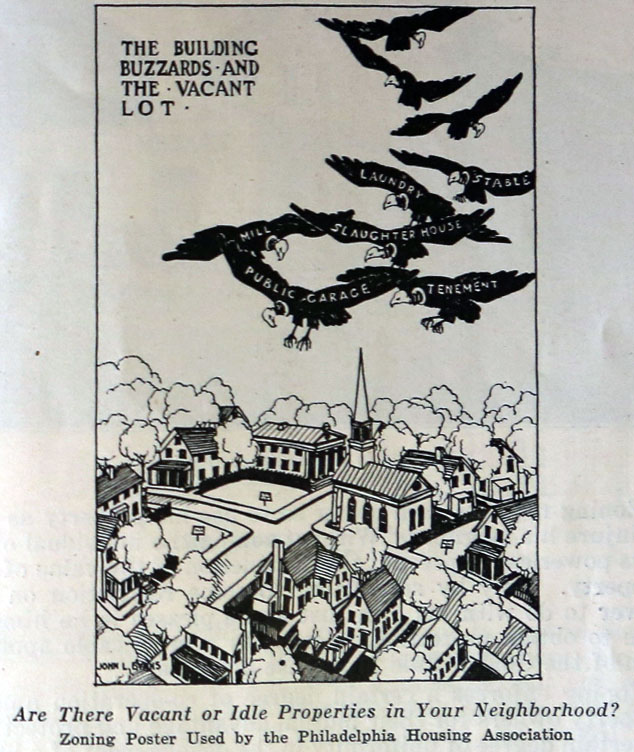
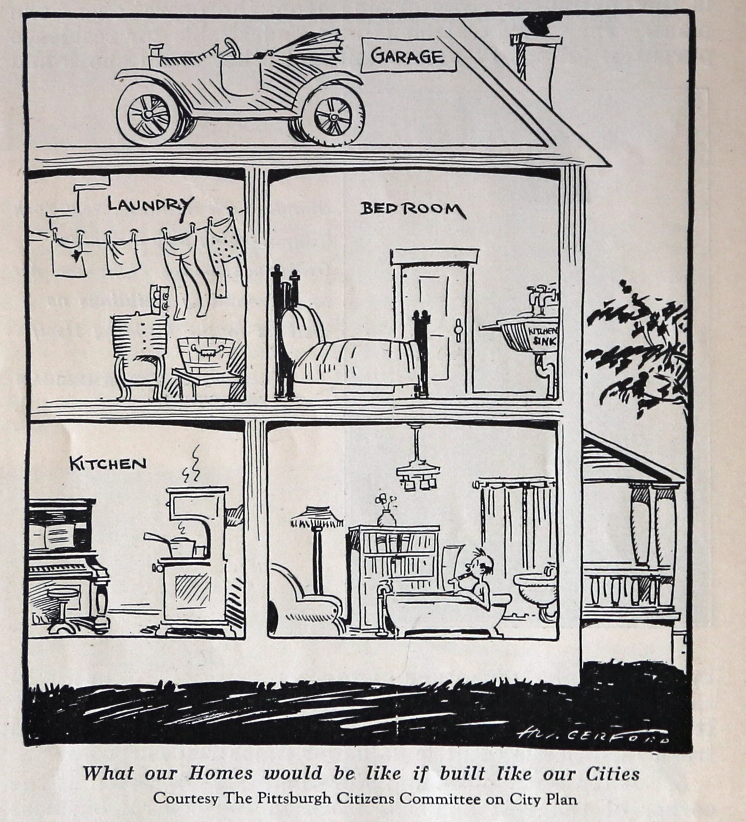
1923: The Columbus Zone Plan: A Report Outlining a Tentative Zone Plan for Columbus, Ohio
By Robert Whitten, Consultant, and A.H.C. Shaw, Engineer for the City Planning Commission. Columbus, Ohio, 1923.
Report here (2mb PDF)
In 1922, the Columbus Planning Commission was created and the city hired Cleveland zoning expert Robert Whitten. Like many cities at the time, Columbus saw zoning as the means to creating an orderly city and this report typifies the period’s faith in rational planning by experts.
These cartoons were taken from the report.
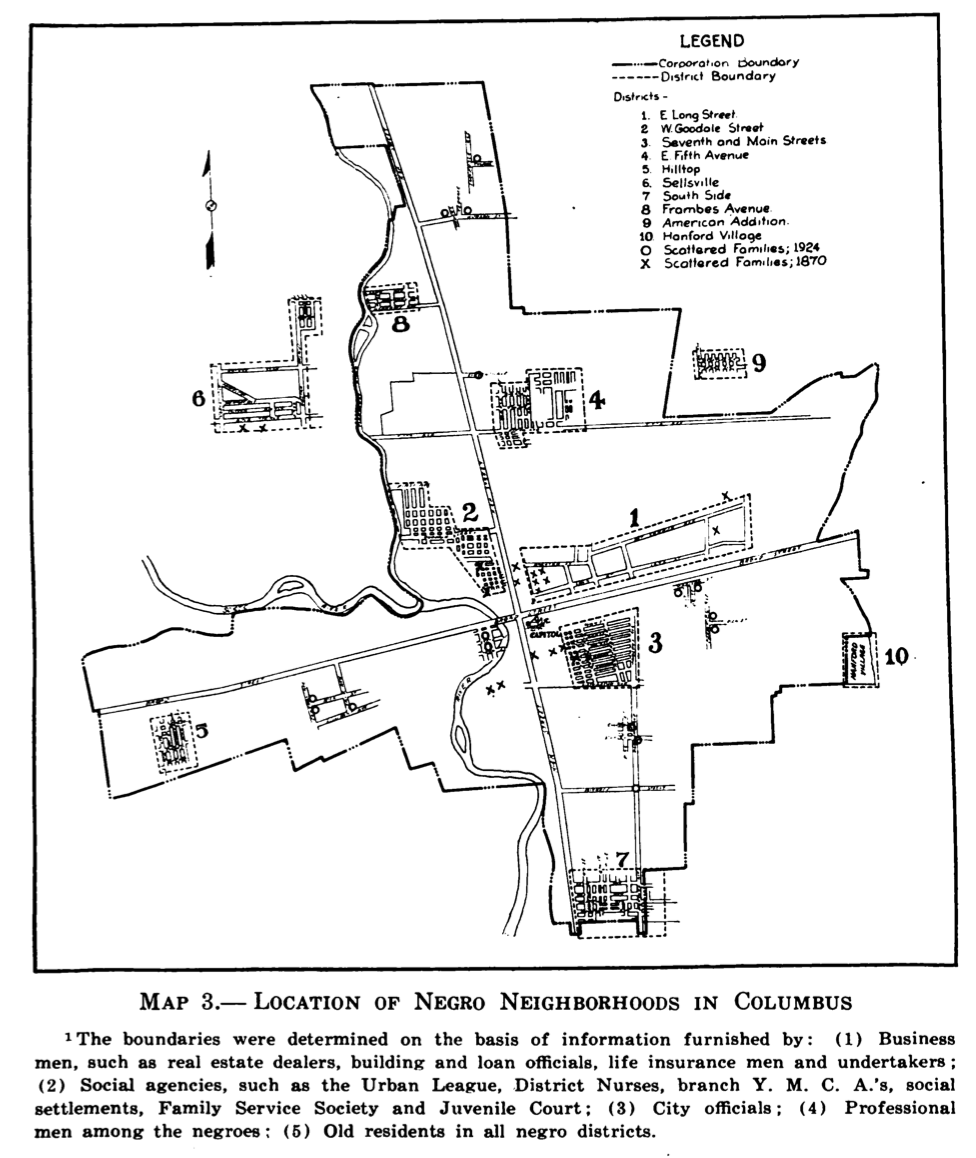
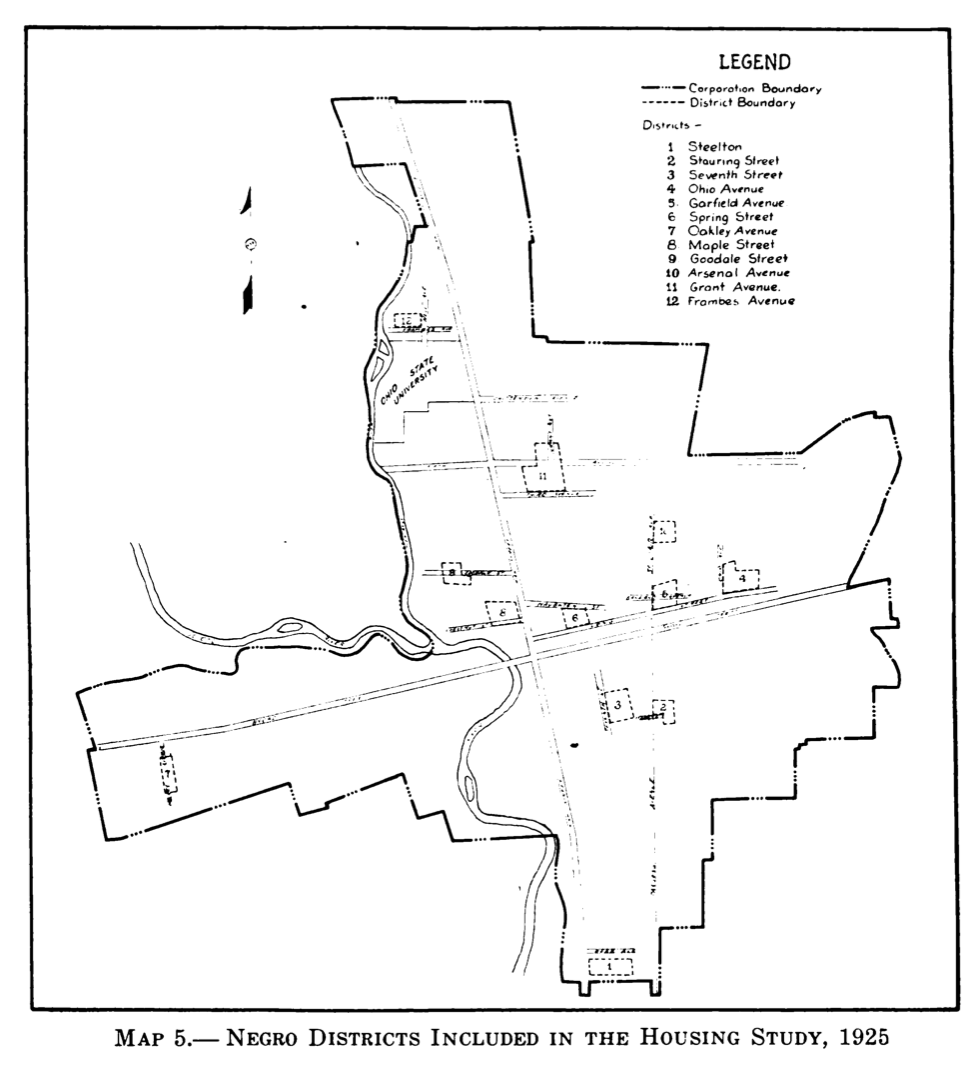
1928: Negroes in Columbus
By Mary Louise Mark. Columbus: The Ohio State University Press, 1928.
Full text version if book is available from the HathiTrust Digital Library.
Sociologist Mary Louise Mark’s survey of African Americans in Columbus, published in 1928 contains a wealth of data on black neighborhoods in Columbus. Maps below show “negro neighborhoods” around the mid 1920s, and a 2nd map shows areas included in the housing study documented in Mark’s book.
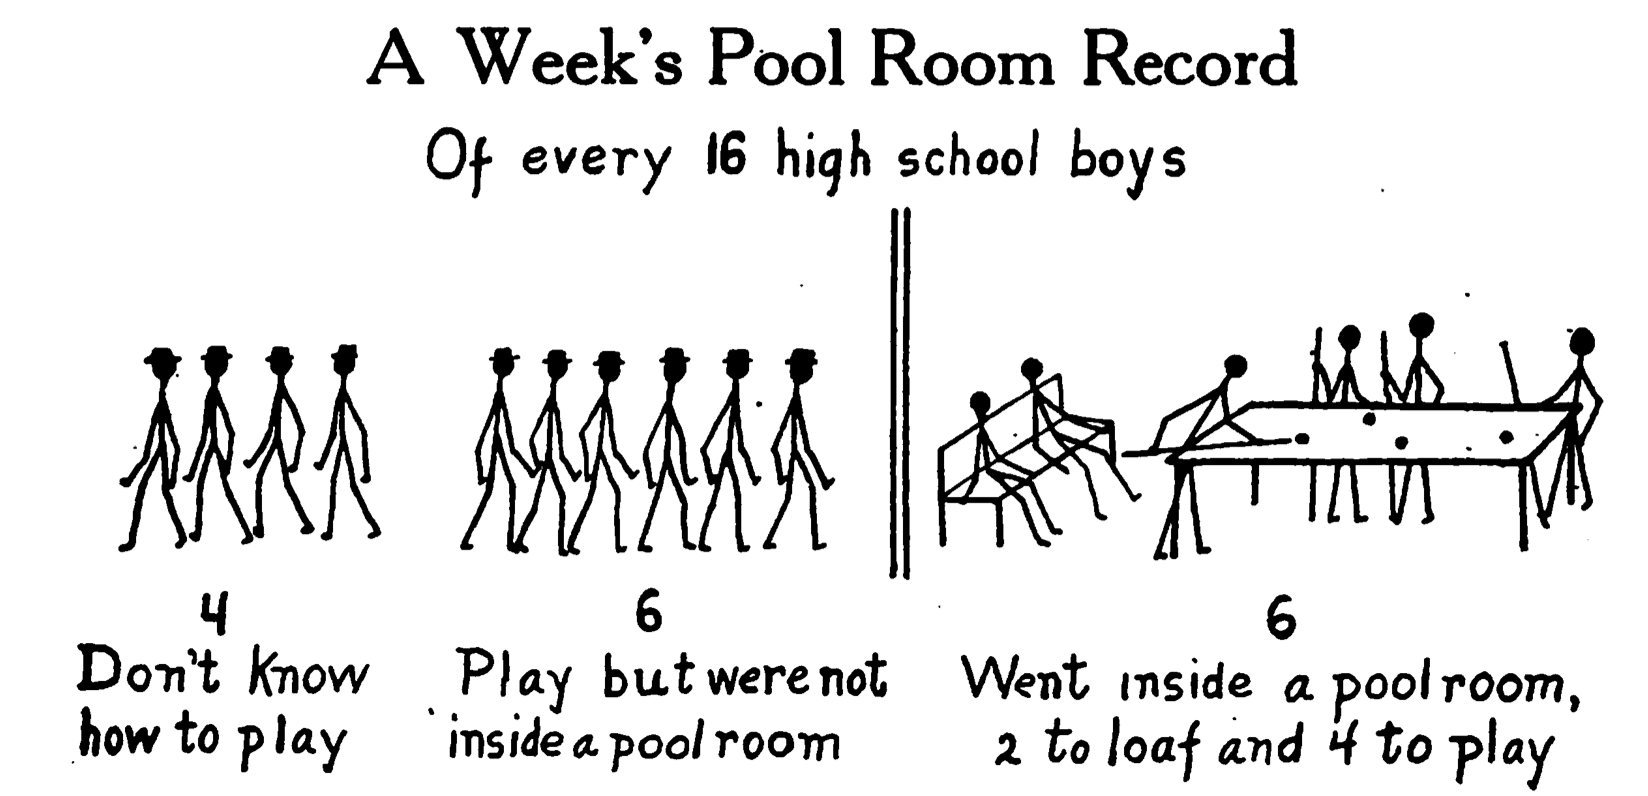
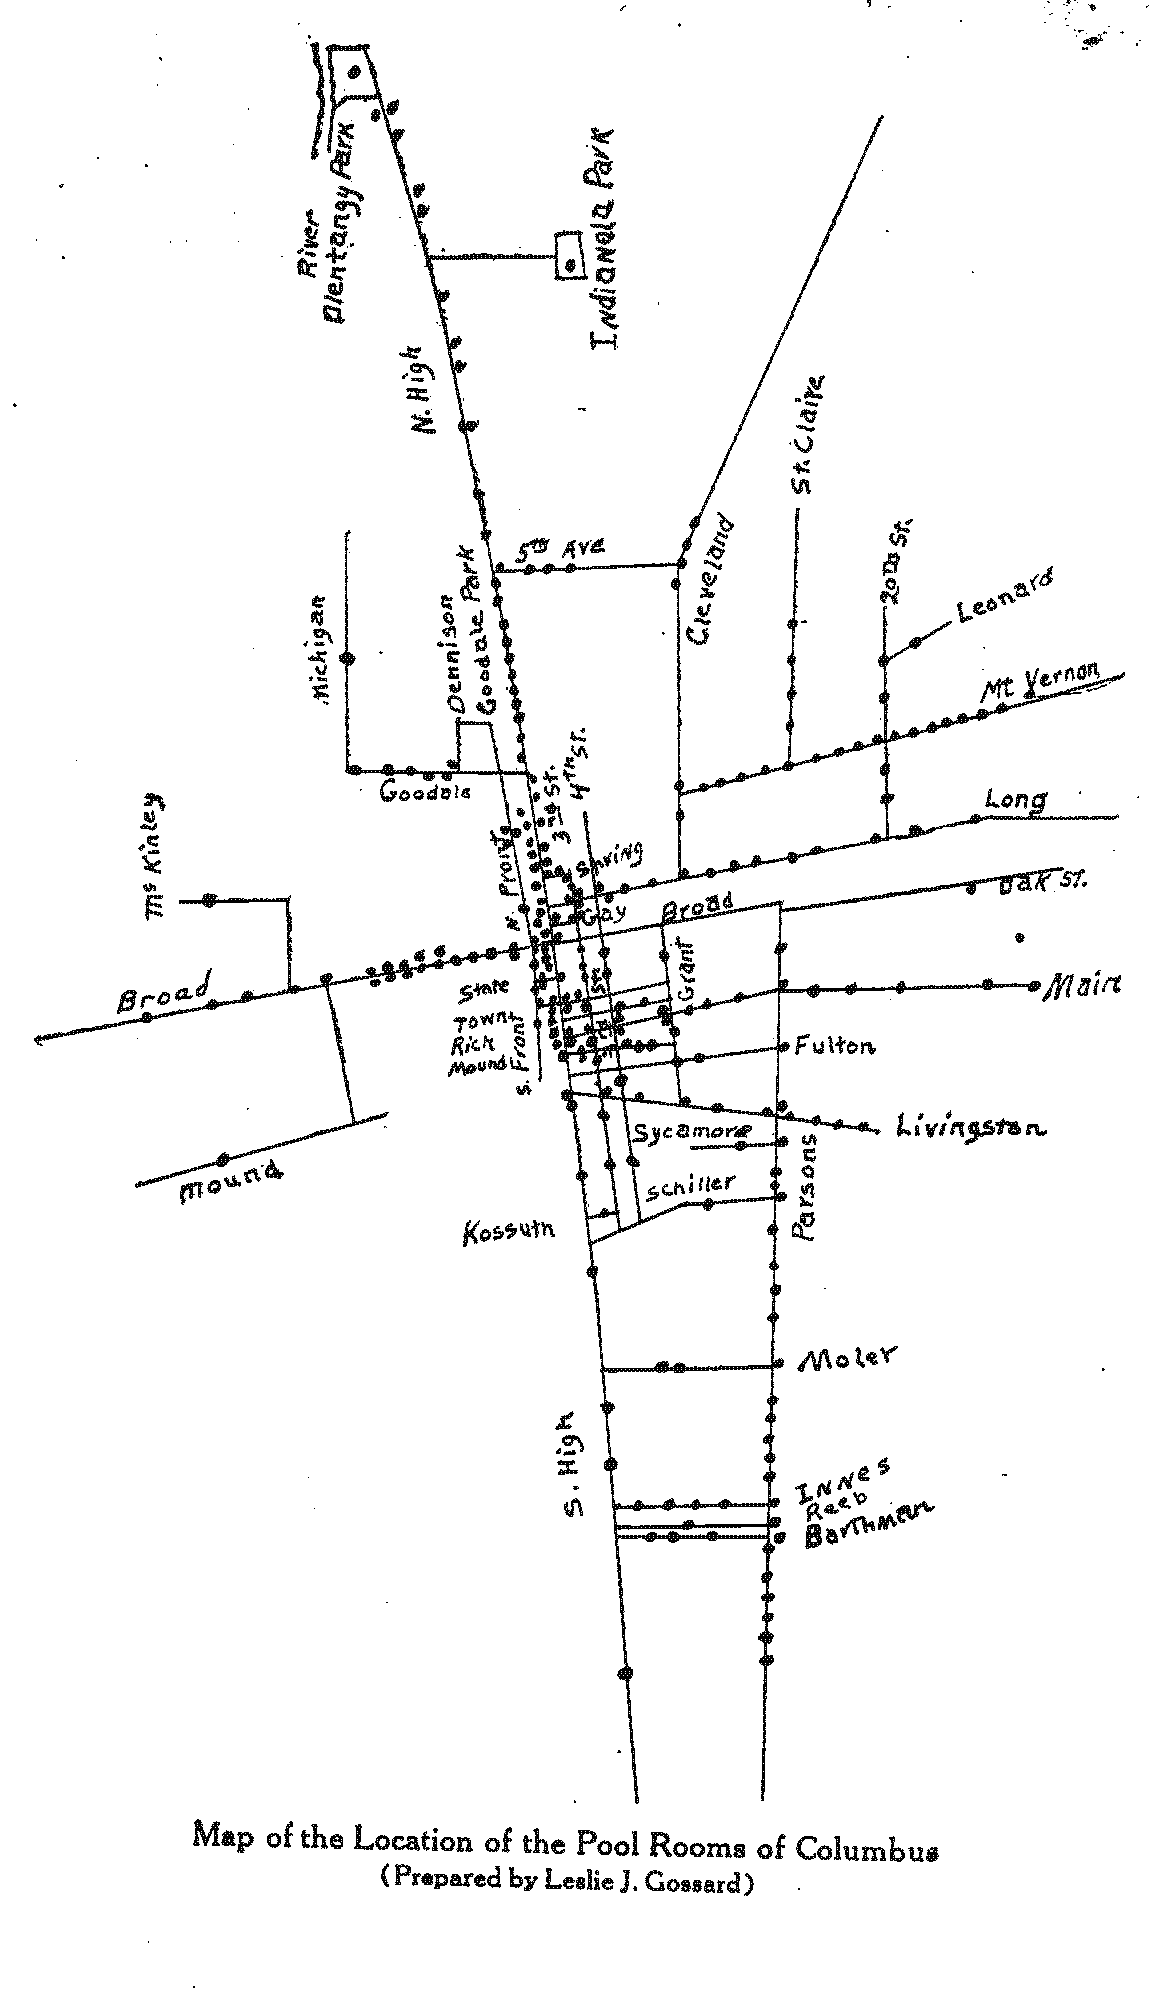
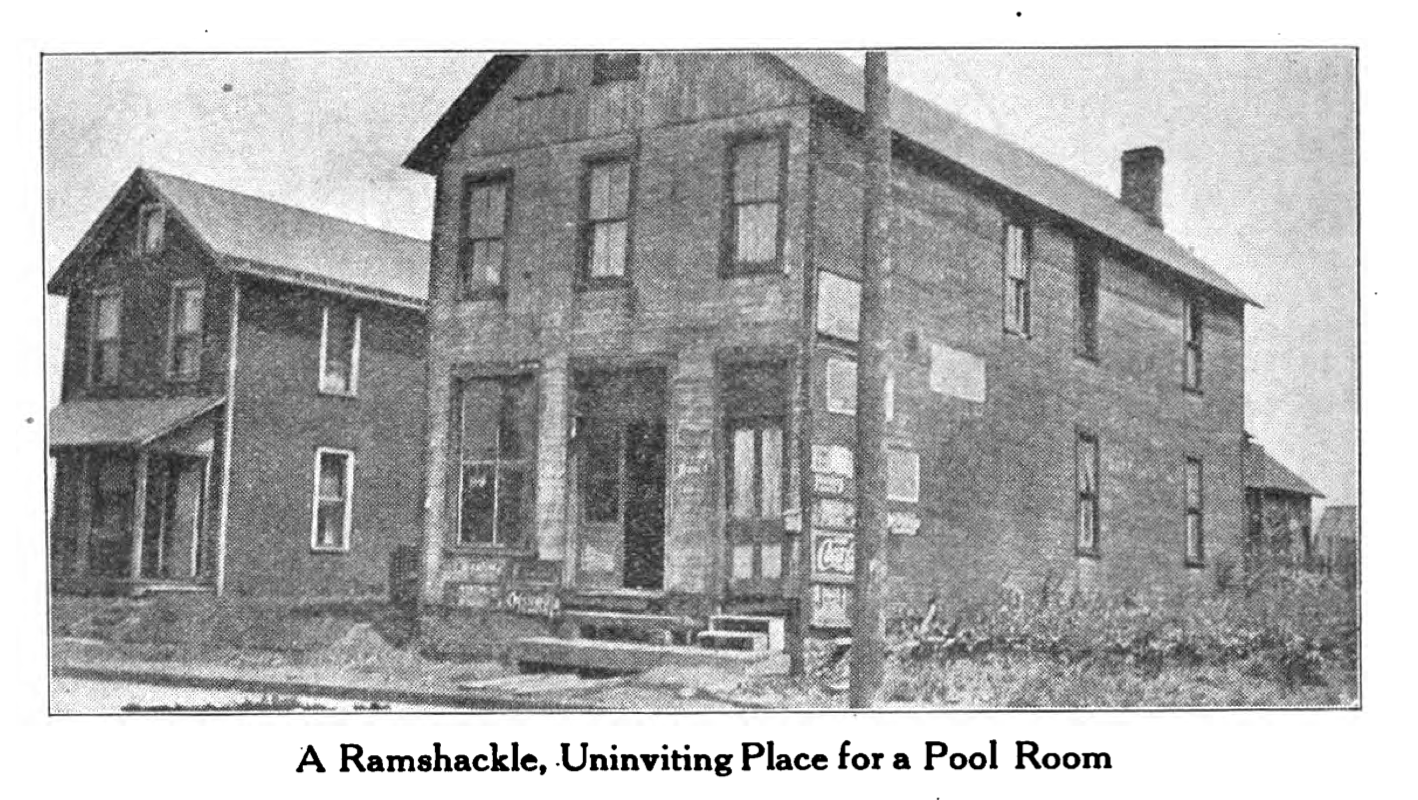
1916: Columbus Pool Rooms: A Study of Pool Halls, Their Uses by High School Boys, and a Summary of Public Billiard and Pool Room Regulations of the Largest Cities in United States
By Survey Committee of the Central Philanthropic Council. Columbus: Central Philanthropic Council, 1916.
Full text version of the book here (10.2mb PDF) or on Google Books here.
Delinquency was one of the early 20th century concerns in many places in the U.S. Pool halls were a focus of attention, as a source of temptations for juveniles. This survey of Columbus pool halls provides a snapshot of a pervasive part of early 20th century urban landscape, with maps, images and judgmental comments throughout.
1954-57: Reports Prepared for the Columbus Planning Commission and the Franklin County Regional Planning Commission.
By Harland Bartholomew and Associates, St. Louis
- 1954. A Report upon economic base, population and land use here (8.1mb PDF)
- 1954. A Report upon major streets and transit here (6.6mb PDF)
- 1954. A Report upon utilities and housing here (6.1mb PDF)
- 1955. A Report upon the central business district here (6.8mb PDF)
- 1956. A Report upon land use and zoning here (3.1mb PDF)
- 1956. A Report upon transportation here (5.8mb PDF)
- 1956. A Report upon transit here (4.1mb PDF)
In response to the unprecedented growth of American cities following World War II, the US Congress passed Federal Housing Acts in 1949 and 1954 that provided cities funding for studies that would facilitate slum clearance programs and urban renewal projects. Columbus hired the nationally known consulting firm of Harland Bartholomew and Associates out of St. Louis to prepare twelve preliminary reports that would serve as the outline for a master plan. Between 1954 and 1957, the $90,000 study produced the seven reports linked to above, as well as additional reports on housing (1955), capital improvements (1956), and public buildings (1956) as well as a summary report (1957).
Volume 21, Number 3/4. Online here.